
California's crime rates are falling, which is positive news for businesses across the state. Violent crime dropped 10.2% in 2025 to 431.1 per 100,000 people, and property crime dropped 14.3% to 1,785.8 per 100,000 people. Those statewide figures can't tell you how exposed your own site is, though, because risk changes from one region and site type to the next.
Property crime deserves particular attention when you're protecting a business, with 705,925 offenses reported in 2025 compared with 170,397 violent crimes.
In this article, we'll cover what California's crime data can and can't show, how risk changes by region and city, which locations carry the greatest exposure to property and asset crime, and how a location-specific assessment helps you make proportionate security decisions.
Where Crime Risk Is Highest Across California
California's crime risk narrows from broad regional patterns down to individual cities and streets, and each level tells you something different about your site.
Regions
The highest risk region depends on the crime you're trying to prevent. The Public Policy Institute of California's (PPIC) latest 2024 regional analysis places the San Joaquin Valley highest for violent crime at 603 per 100,000 residents and the San Francisco Bay Area highest for property crime at 2,678.
The southern coast and border, which includes San Diego County, had the lowest violent crime rate at 331, while the Sierra region had the lowest property crime rate at 976.
A business operating in both the San Joaquin Valley and the Bay Area could therefore need a different security approach in each region. Local trends can differ as well, with the same analysis showing property crime falling 27.2% in San Francisco County and 21.1% in Alameda County in 2024, while rising 2.7% in Santa Clara County, home to San Jose, and 1.8% in Fresno County.
Checking your county's direction gives you a far better guide than a statewide figure.
Cities in California
Lists of dangerous cities and safest cities are easy to find, but they rank each one on a single number that leaves out a lot of what you need to know. The FBI has a long-standing policy against ranking jurisdictions on crime data alone, since population density, commuting patterns, economic disparities, and crime reporting practices all influence local numbers.
However, city rates can still be helpful when you read them with that context in mind. FBI data for 2025 puts violent crime per 100,000 residents at 1,475 in Oakland, 1,027 in Stockton, and 892 in San Bernardino. In Compton, the Los Angeles County Sheriff's Department recorded 1,122 violent offenses in 2025, which works out to about 1,191 per 100,000 based on a population of 94,182.
Population size can change how these rates look, too. The Commerce figure reflects about 150 offenses among about 11,800 residents, and the calculation doesn't count the workers and visitors who spend time there.
A violent crime rate also won't tell you how exposed your yard or jobsite is to theft, since 69.6% of California’s violent crime in 2025 was aggravated assault. Property crime is a closer guide for your site, and it can vary from one street to the next.
A 2026 study of 12 U.S. cities found that half of property crime occurred on 0.9% to 6.9% of street segments, depending on the city and year. About 27.1% of the segments recorded no property crime at all between 2010 and 2018, so 2 sites a few blocks apart can have very different histories and security needs.
California Locations With the Greatest Exposure to Property and Asset Crime
Your exposure depends on what you keep on-site and how easily it can be removed, which is why cargo, copper, retail stock, vehicles, and vacant buildings each attract different offenses. Understanding the pattern for your type of site makes it easier to choose security coverage that fits.
Logistics corridors
Freight sites need to watch how cargo theft moves, because a county's past record won't always reflect its current risk. California recorded 1,218 cargo theft incidents in 2025, more than any other state, with incidents falling 11% in Los Angeles County while rising 82% in Kern County and 44% in San Joaquin County.
That has continued to change throughout 2026. California logged 277 incidents in the first quarter, which was up from 255 the year earlier, before CargoNet reported second-quarter declines that were especially apparent in California.
Read more:
- Cargo Theft, California: Why Logistics Sites Are High-Risk
- 8 Risks Impacting Logistics and Distribution Sites in California
Construction jobsites
Copper and other materials left on a jobsite in California after hours are a well-documented target. AT&T recorded 4,300 copper theft incidents in the state in 2025, with losses exceeding $57 million, and it names construction projects among the targets.
Los Angeles also ranks first nationally for wire and cable theft, with more than double the number reported in Houston. Early project phases can be even harder to protect because power and internet often aren't connected yet.
Read more:
- How to Prevent Construction Site Theft in California
- Construction Jobsite Theft in California: How Big Is the Problem?
Retail and commercial corridors
Businesses in commercial corridors often need to plan for in-store theft and break-ins at the same time, and a wider plan to address organized retail crime (ORC) needs to cover both. California agencies recorded 121,339 shoplifting offenses in 2025, which was down 8.1% from 2024 but still 89.3% above 2020's recorded figures.
Commercial locations also accounted for 11,322 robberies, and nonresidential properties accounted for 62.2% of burglaries.
Read more:
- 8 Types of Theft Affecting California Businesses and Jobsites
- The Rise of Organized Retail Crime: California
Vehicle and fleet yards
Vehicle theft is falling, but California still had the highest total of any state in the first half of 2026, with 57,821 vehicles stolen. The Los Angeles metro area recorded 21,540 thefts and the San Francisco metro area recorded 9,825, while Riverside-San Bernardino recorded 5,937.
Bakersfield-Delano had the highest theft rate of any metro area at 223.28 per 100,000 people, so a yard outside the largest metros shouldn't assume its risk is lower.
The state's clearance rate for motor vehicle theft was 6.6% in 2025, which means fewer than 10% of reported cases were solved, so good records of the vehicles using your yard give you and investigators more to work with.
Read more:
Vacant sites and outdoor assets
California only recovered 10% of non-vehicle property by value in 2025, so anything taken from a vacant building or outdoor yard is unlikely to come back. Long stretches with nobody on-site also give offenders more time to work unnoticed, which makes prevention especially valuable at these locations.
Vacant properties can face metal theft, repeat trespassing, fire exposure, and stricter insurance requirements. Additionally, fire belongs in that assessment because the state recorded 7,089 arsons in 2025, and 4,157 of them started on property outside buildings and vehicles, such as timber and fences.
What California's Crime Data Can Tell You About Security Risk
Crime data can give you a strong starting point for a security decision over your site, but it only shows what was reported. Nationally, about 30% of property victimizations were reported to police in 2024, ranging from 25% for general theft to 75% for motor vehicle theft. Smaller thefts from your site may therefore never appear in the figures you're relying on.
That gap is more evident in cities. Between 2020 and 2023, 25% of urban property victimizations reached police, compared with 33% in suburban areas and 36% in rural areas, so your own incident records matter as much as the published rate.
It's also worth checking how complete the data is before you rely on a year-on-year change. Some California agencies didn’t submit a full year of crime data for 2025, so part of any drop from 2024 could simply reflect missing reports.
The San Diego Sheriff’s Department, for example, couldn’t report all of its data for January through June, which is why the California Department of Justice advises caution when comparing 2025 with earlier years.
The same report notes that the Oakland Police Department revised its 2023 figures after finding reporting inaccuracies.
National comparisons are useful context for internal discussions, as long as they're presented with care. The FBI's 2025 national averages were 327.6 violent crimes and 1,534.8 property crimes per 100,000 people, both below California's state-reported rates. The FBI also says its figures may not be directly comparable with other organizations' data, so it's best to treat that gap as a general guide.
Mobile Surveillance Options for Higher-Risk California Sites
Mobile surveillance gives you coverage without waiting for permanent infrastructure, and you can build that protection in layers around the risks at each site.
Your available power and infrastructure decide where to start, and your biggest risks decide what to add. A vacant building that sits unattended for long stretches calls for early warning of intruders, for example, while a freight site or fleet yard also needs a record of the vehicles coming and going.
Coverage Without Power or Internet
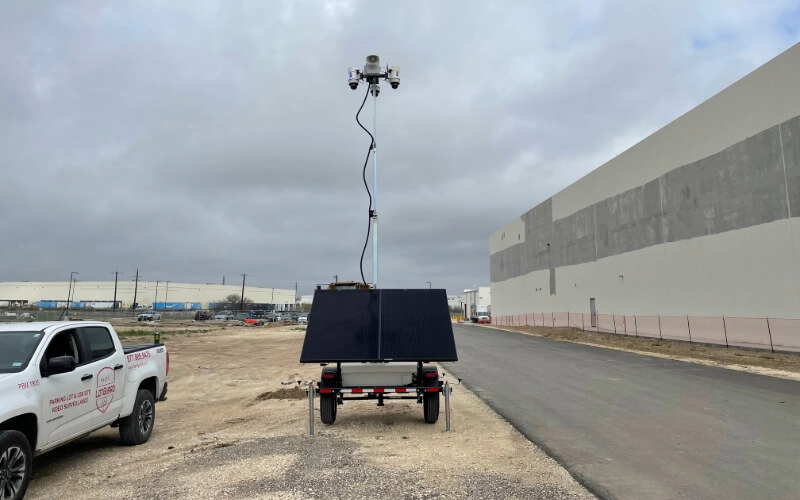
A site with no power or internet connection can still have live coverage. Our Solar Surveillance Trailers run on solar and battery power and send live video over 4G/5G cellular networks, and they can be deployed within 20-minutes for basic setups. Masts up to 20 feet carry Pan-Tilt-Zoom (PTZ) cameras with near-360° coverage, giving you a wide view from a single unit.
Built-in speakers allow live monitoring operators to issue live audio warnings to potential offenders. Our team or your on-site crews can reposition the trailers as your site changes, and rental gives you the flexibility to match coverage to temporary or targeted needs.
Coverage from existing poles and buildings
Existing structures can support surveillance when your site already has power available. Our Pole Cameras are compact, relocatable units that mount to existing poles or buildings. High-definition video and infrared night vision support clear footage after dark, while built-in cellular connectivity gives your team remote access.
AI-video analytics detect defined activity, and trained operators provide 24/7 live monitoring and can escalate incidents to law enforcement when necessary.
Earlier warning of unauthorized access
Early notice of unauthorized access gives your team more time to respond, which matters when after-hours theft or repeat trespassing are your main concerns.
Adding Intrusion Detection to your trailers or pole cameras builds that protection into your coverage, using AI analytics to spot unauthorized access around your perimeter or within defined zones. You can set custom detection zones and schedules to suit how your site operates, and it filters out wildlife and weather, meaning fewer false alarms.
Each alert includes a snapshot and video clip, so your team can see what triggered it.
A clearer record of vehicle activity
Reliable vehicle records make it easier to establish who came onto your site and when, which strengthens your protection when vehicles are part of the risk, such as cargo theft at a freight yard or equipment driven off a jobsite. License Plate Recognition (LPR) adds that layer to your trailers or pole cameras by capturing the plate, make, model, and color of each vehicle entering your site.
It works 24/7, and watchlists flag known or blacklisted vehicles. Searchable records of plates and footage also make it quicker to find a specific vehicle after an incident.
All of these systems connect to our cloud-based platform, which you can access from any connected device to view up to 81 cameras, review footage, manage alerts, and generate reports. Having that information in one dashboard makes it easier to compare activity across your California sites and to see where risk is changing, without the need for extra site visits.
Each intrusion event is also logged with its location, date, time, and linked video evidence, so your team has a clear record to draw on for audits, investigations, and internal reviews. Over time, that record shows the trends and patterns at your own site, so you can personalize your coverage around what’s actually happening there.
Read more:
- Choosing Mobile Surveillance for High-Risk California Locations
- How to Monitor Remote and Off-Grid Locations Across California
Matching Your Security to the Local Risk at Each Site
California agencies reported $4.37 billion in stolen property in 2025, but only 25.4% of that value was ever recovered. A theft can also lead to delayed work, replacement orders, added labor, and insurance claims, so it pays to know where your exposure really sits.
A city's overall crime statistics can't show you that, but a location-specific risk assessment can. Keeping up with local crime reports shows you how trends are moving in your area, while the data from your surveillance systems shows what’s happening on your site. You can use both to prepare, starting with your high-value assets and the hours they’re unattended.
The results give you a clear reason for each security decision, which makes the spend easier to explain to your finance team or project leadership. Regular reviews will also keep your approach in step with local patterns, which can change quickly over the course of the year. If you're ready for a security setup recommendation for your specific California-based site, speak with our team today.
